How to Automate Repetitive Tasks: Start at the Bottleneck
Summary
To automate repetitive tasks, first measure them: log how often each runs and how long it takes, then rank by frequency, time cost, error risk and ease of automation. Build the top scorer first, and check that it sits on your bottleneck, the step that caps total output. Automating any other step leaves throughput unchanged. Start with a simple trigger and actions flow, test it on real items, then re-measure after two weeks.

How to automate repetitive tasks well comes down to one rule: the one that limits your output, not the one that annoys you most. List your recurring tasks, time each one, score them on frequency and error risk, and build the top scorer first. A task that runs 40 times a week and takes six minutes is worth an afternoon of setup. A task that merely irritates you rarely is not. Do this in order and the hours you win show up in throughput, not just in a calmer inbox.
Which repetitive tasks are actually worth automating?
Picture a small fulfillment team. Someone copies order numbers from an email into a spreadsheet, another person renames files, a third pastes tracking links into a support reply. Every one of those chores feels like a candidate. Only one of them sits on the critical path.
A good candidate has three traits. It happens often, it follows fixed rules, and it needs almost no judgment. Slack's own guide to automating repetitive work uses the same filter: if a task is frequent and feels more mechanical than meaningful, it is probably a fit. Add a fourth trait from the ops side: errors on this task cost real rework downstream.
Tasks that fail the filter are just as useful to name. Anything that needs context, negotiation, or a call on an edge case stays with a person, at least for now. Automating those tends to produce a fast wrong answer, which is worse than a slow right one.
How do you measure a task before you automate it?
Guessing is where most automation projects go sideways. People remember the annoying task, not the expensive one. So measure first.
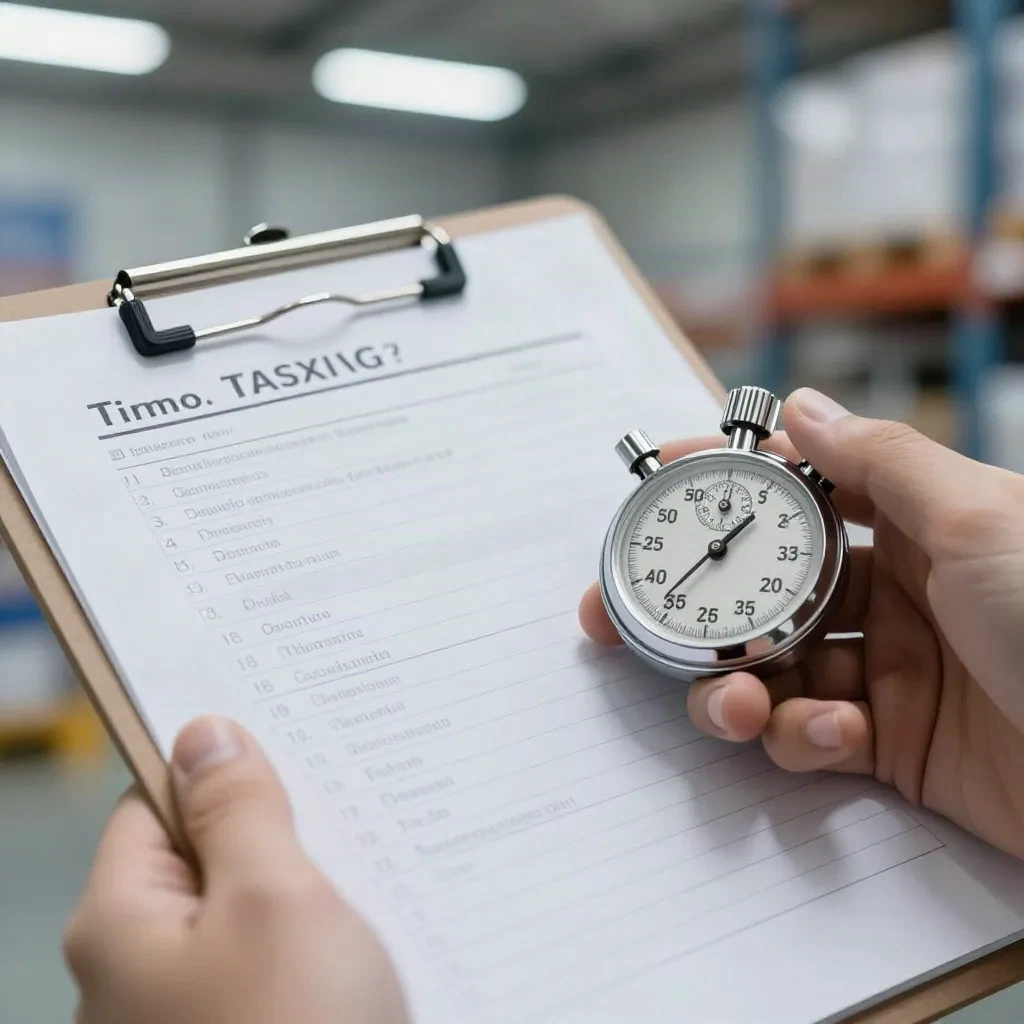
Run a one-week time study. Each person logs, for every recurring task, how many times it happened and how long it took. A stopwatch or a plain spreadsheet is enough. You are after three numbers per task: frequency per week, minutes per run, and how often it goes wrong.
Then compute the weekly cost of each task with one line:
Weekly hours = (Runs per week x Minutes per run) / 60Runs per week and minutes per run come straight from your log. A task with 40 runs at 6 minutes costs 4 hours a week. A task with 3 runs at 25 minutes costs 1.25 hours. The second one feels heavier, but the first one is where your time actually leaks.
This is also where the AI analysis badge on our calculators earns its place. Enter the cycle time (the minutes one unit of work takes from start to finish) for each step and the tool reads the result for you, flagging which step caps the whole flow and what the number means in plain language. You get a verdict, not a column of figures to interpret.
Why does automating the wrong step change nothing?
Here is the part most automation guides skip. In any chain of steps, the slowest step sets the pace of the whole chain. Operations people call that step the bottleneck (the station that caps the output of the entire line). Speed up any other step and the total output does not move.
A packing line shows it clearly. Say picking handles 120 orders an hour, packing handles 80, and labeling handles 150. The line ships 80 orders an hour, no matter how fast labeling gets. Automating labeling to 300 an hour changes nothing except the size of the queue sitting in front of packing.

The same logic holds for office work. If invoices wait three days for approval and take four minutes to enter, automating the data entry will not shorten the three days. The wait is the constraint. Little's Law (WIP = Throughput x Cycle Time, where WIP is the work in progress sitting in the system) makes the point numerically: if 60 invoices are in flight and you clear 20 a day, each invoice spends three days in the system. Cut the entry time to zero and you still have 60 invoices waiting on the same approver.
So the sequence is: find the limiting step first, then ask whether that step is a repetitive, rule-based task. If it is, automate it. If it is not, fix the process around it before you buy anything.
How do you score and rank your candidates?
Once you have measured data, ranking is arithmetic. A simple scoring scheme, popular in process audits, rates each task from 1 to 5 on frequency, time cost, and error risk, adds those up, then multiplies by an ease-of-automation rating from 1 to 5.
Priority = (Frequency + Time + Error risk) x EaseFrequency, Time, and Error risk are each scored 1 to 5 from your log. Ease is 5 when a tool already has a connector for the apps involved and 1 when the task needs custom code or a person's eyes.
Take two tasks. Copying order data into a sheet scores 5 for frequency, 3 for time, 4 for error risk and 5 for ease: (5+3+4) x 5 = 60. Drafting custom supplier replies scores 2, 4, 3 and 1: (2+4+3) x 1 = 9. The ranking is obvious, and so is where to start.
One rule overrides the score. If the highest-scoring task is not on the constraint, check whether a slightly lower-scoring task is. Automating the constraint beats a clean score every time.
What does a first automation look like in practice?
Keep the first build boring. Pick the top-scoring task and describe it as a trigger, a few actions, and an end state. "When a new order email arrives, extract the order number, add a row to the tracking sheet, and post a note to the team channel" is a complete spec.
Most no-code tools build exactly this shape. A trigger starts the run, actions follow in sequence, and optional filters stop it when conditions are not met. You do not need code for the first version.

Test with a handful of real items before you switch it on for everyone. If the team starts ignoring the alerts, your triggers are too loose, so add a filter. Write down what the automation does and who owns it, in two or three lines. An unowned automation breaks silently the first time an app changes its fields.
Which tool fits which kind of task?
Tool choice matters less than task choice, but it still saves or costs you money. Here is how four common options compare on the criteria that matter for repetitive work.
Zapier: best for non-technical teams and the widest app catalog. Billed per task. Free plan with 100 tasks a month.
Make: best for branching flows and lower cost at volume. Billed per credit. Free plan with 1,000 credits a month.
n8n: best for technical teams that want self-hosting and code in any node. Billed per workflow execution. Free self-hosted Community Edition.
Activepieces: best for open-source setups. Free to self-host under an MIT-licensed Community Edition.
Pricing changes often, so check the vendor page before you commit. The structural difference is what lasts. Zapier bills per task, so a ten-step automation costs more to run than a three-step one. n8n bills per workflow execution rather than per step, which favors long, branching flows.
Zapier is the default when nobody on the team writes code and you need a connector for an obscure app. You pay for that breadth as volume grows.
Make gives you a visual canvas with routers and error handling, which suits flows that branch on conditions. It is also cheaper per operation than Zapier at higher volume.
n8n suits teams with someone technical who wants to own the stack. You can self-host it and drop JavaScript into any node when a connector falls short.
Skip Activepieces if you need the very largest connector catalog today, since it is a younger project. Pick it if open source and self-hosting are requirements.
What should you skip, even though everyone recommends it?
Three popular suggestions deserve a pushback.
First, skip "automate everything you can." Every automation is a small system you now maintain. Ten brittle flows cost more attention than the tasks they replaced. Automate the top few from your ranked list and stop.
Second, skip tool-first shopping. Buying a platform before you have measured your tasks gives you a very capable tool pointed at nothing in particular. Measure, rank, then pick.
Third, skip automating a broken process. If the steps are unclear, the handoffs are inconsistent, or the same request arrives in five formats, automation only produces the same mess faster. Clean the process up on paper first. A single day of mapping steps and owners often removes a third of the work before any tool is involved.
How do you know the automation paid off?
Measure the same three numbers again two weeks after launch: runs per week, minutes per run, and error rate. Compare them with your baseline log. If the task cost 4 hours a week and now costs 20 minutes of supervision, you recovered about 3.7 hours weekly, roughly 190 hours a year.
Then check the line, not just the task. Did throughput at the constraint rise? Did the queue in front of it shrink? If the answer is no, the task you automated was not the limiting one, and the next pass should look at where work is actually waiting.
Review each automation every few months. Apps change, volumes shift, and a flow that made sense in January may be idle by summer.
What should you do this week?
Run the one-week time study. At the end, rank your tasks with the priority formula, check which one sits on your constraint, and build that one in the simplest tool that has the connectors you need. If your ranked top task is under about 1 hour a week of total cost, skip automating it and look at the waiting time between steps instead. That is usually where the real hours are hiding.