An AI analyst for the slowest step.
Throughput and Little’s Law, the bottleneck finder, OEE and process cycle efficiency — four models, one AI that reads the result live, with the formula and the recommendation beside every answer.
Throughput & Little’s Law
The AI relates work-in-progress, cycle time and throughput — change any two and it reads the third, the law every queue obeys.
Throughput = WIP ÷ Cycle timeBottleneck finder
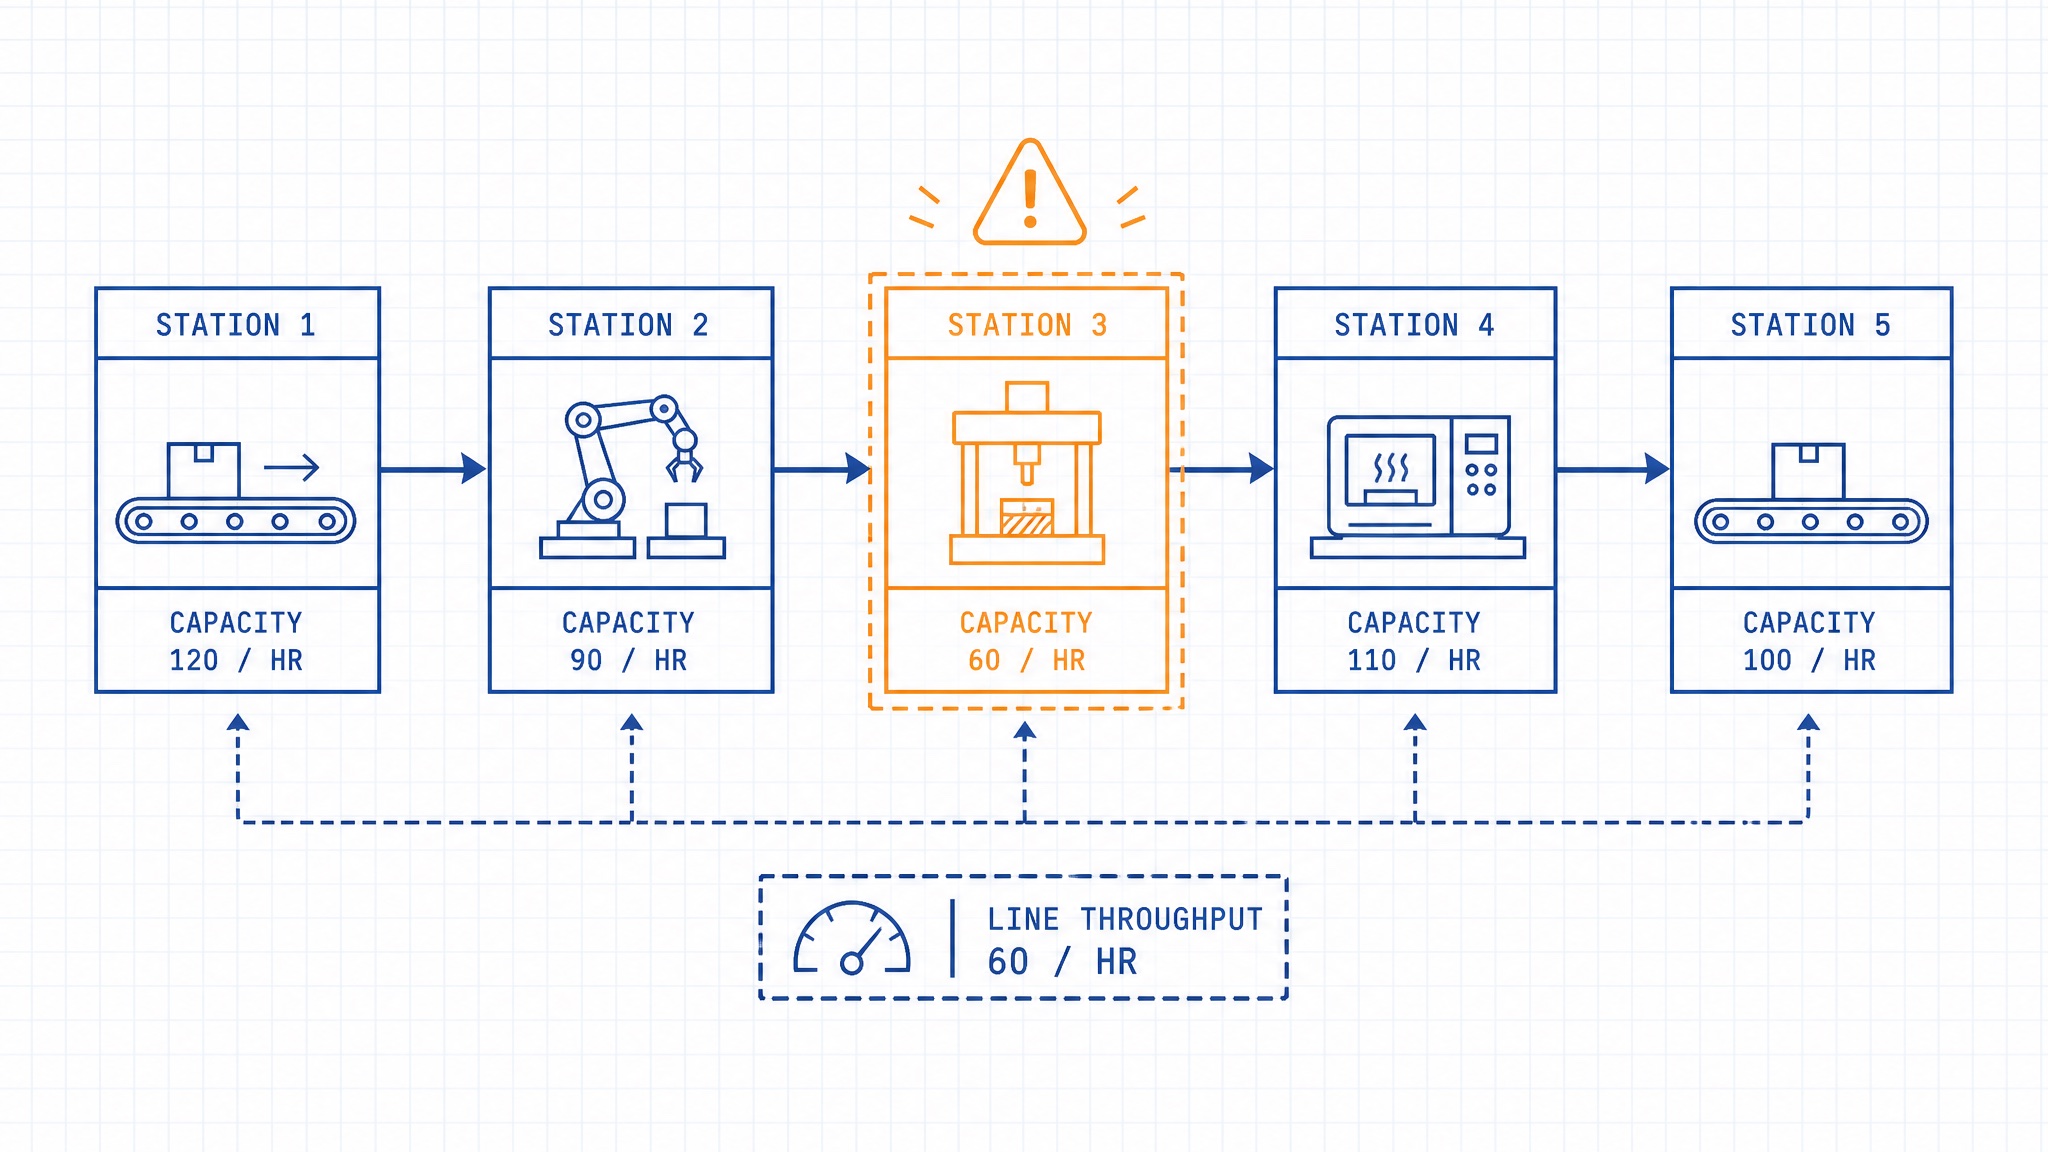
Enter the capacity of each station and the demand. The AI finds the constraint, caps the line’s throughput, and flags exactly where to add capacity.
Throughput = min(station capacity)OEE
The AI turns availability, performance and quality into one honest number for how hard your equipment is really working — and names the weakest link.
OEE = A × P × Q
Process Cycle Efficiency
See how much of your lead time actually adds value — and how much is just waiting in a queue. The AI reads the gap as your opportunity.
PCE = Value-added ÷ Lead timeFour models. One AI read of your slowest step.
Pick a model, change the numbers, and the AI reads the result live — what it means and where to act. Every figure is computed in your browser, then interpreted for you the moment it moves.
Three steps to a number you can act on.
Pick a model or describe your process
Throughput, the bottleneck finder, OEE or cycle efficiency — each maps to a question operations teams ask every week, and the AI knows which math to run.
Enter the numbers
Use the fields or the sliders. Everything computes live in your browser — nothing is uploaded, nothing is stored, nothing to install.
Get the AI’s verdict and next move
You get the figure, the gauge or the flagged constraint, and a plain-English read of what it means and exactly where to act.
Stop guessing where the line slows down.
Open the AI analyst, enter your numbers, and read the constraint with its fix — free, in your browser, in about ten seconds.
Open the AI analyst